NASDAQ / ICT / RANGELIVE FRAMEWORK

TradingView tools by nq.coop

See the move
before the noise.

Two focused indicators that turn structure, liquidity, and range delivery into a clean, readable decision.

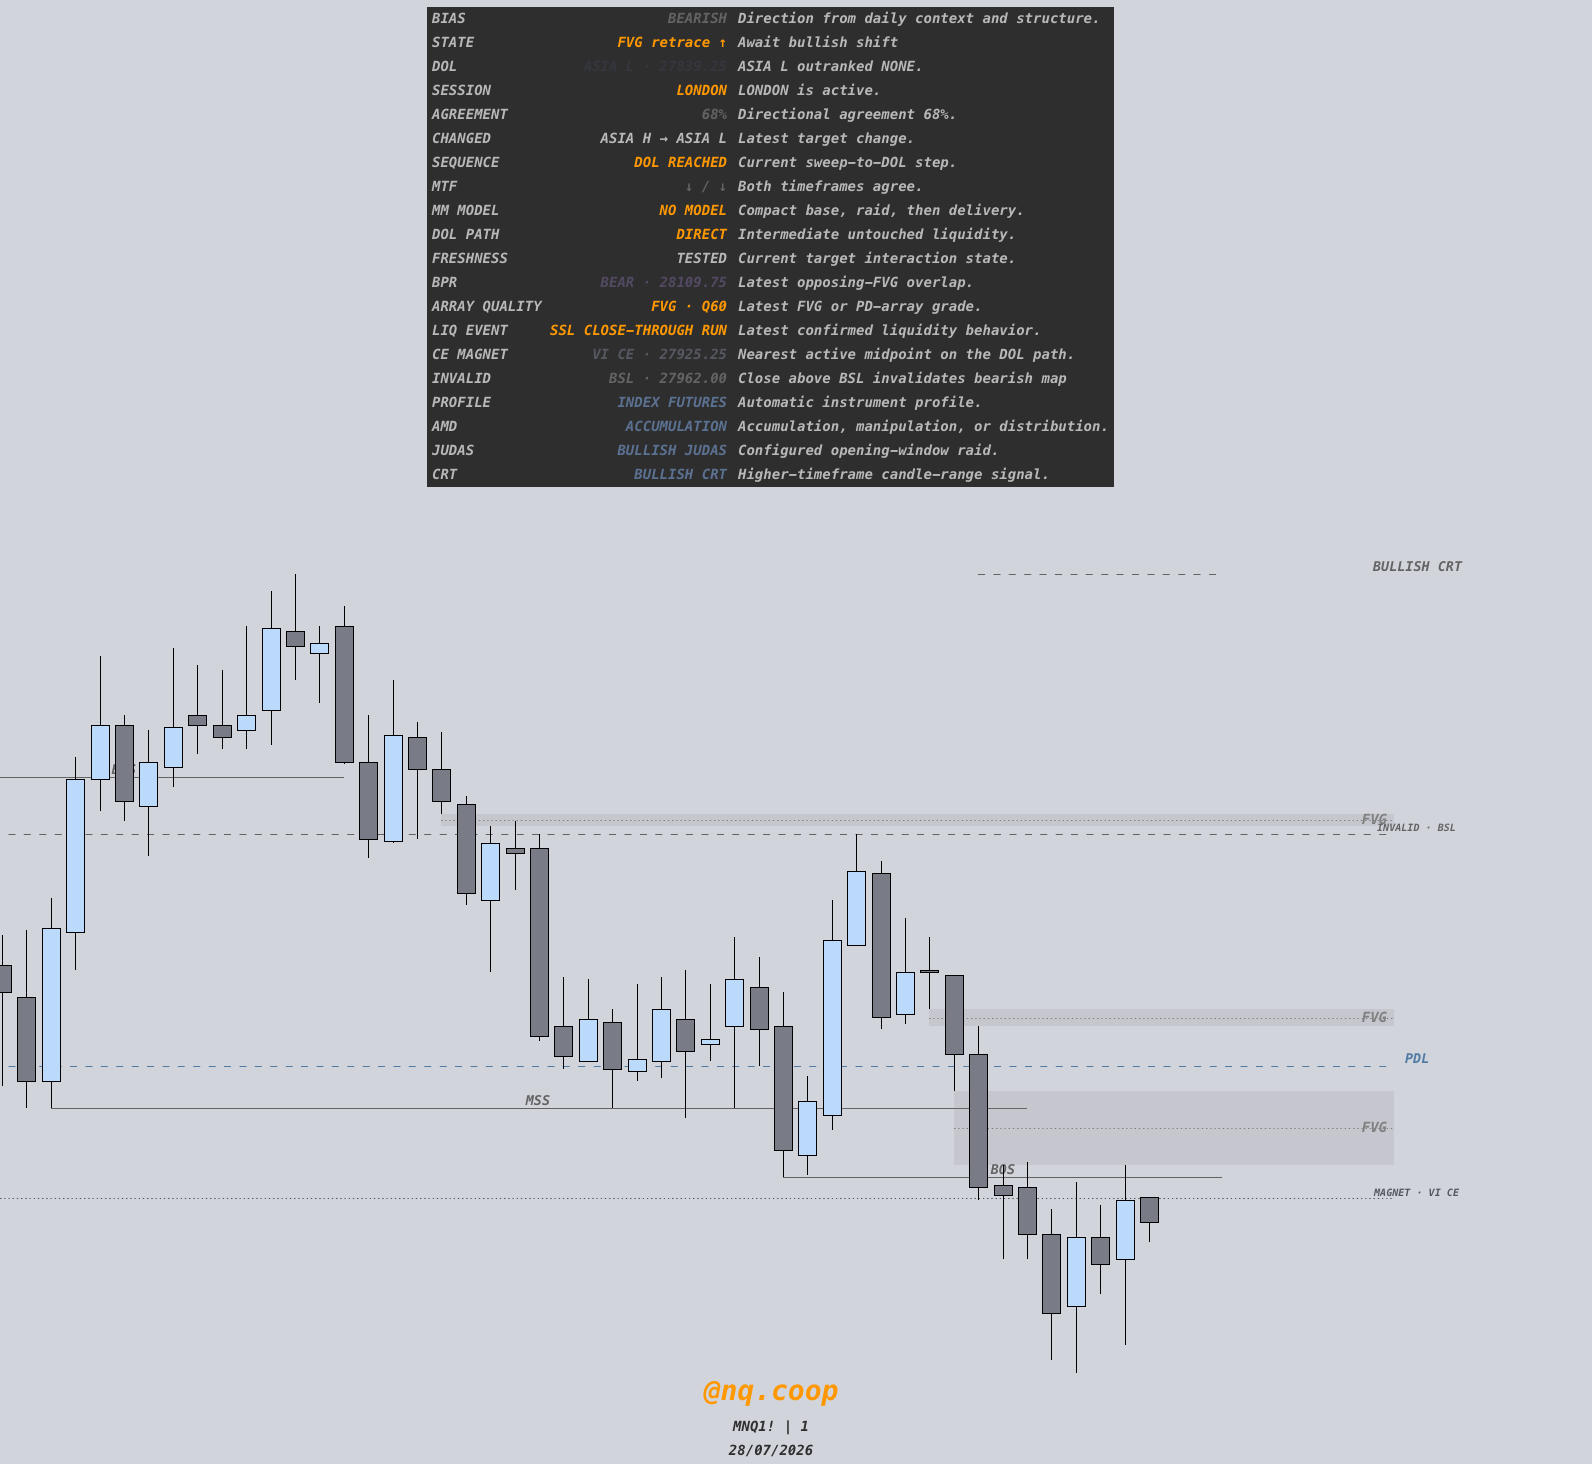
nq.coop ICT indicator running on a TradingView chart with bias dashboard, FVGs, market structure, and liquidity levels
Live indicator capturenq.coop ICT

01 Actual TradingView output. No mockups.

245documented ICT settings
04editable sessions
02maximum forecasts per cycle
$45both indicators together

01 / The indicators

One workspace.
Two precise reads.

The complete ICT workspace maps chart context. Range Analysis stays focused on manipulation, confirmation, and delivery.

PRODUCT / 01FULL MARKET FRAMEWORK

nq.coop ICT

A customizable ICT workspace that organizes bias, structure, liquidity, PD arrays, timing, and draw on liquidity without turning your chart into a wall of labels.

Open the guide
nq.coop ICT indicator running on a TradingView chart with bias dashboard, FVGs, market structure, and liquidity levels
Live indicator capturenq.coop ICT
Complete feature inventory18 modules
  • 01Rules-based higher-timeframe bias
  • 02Ranked draw on liquidity
  • 03Structure and market-shift mapping
  • 04Liquidity pools and sweep context
  • 05Premium and discount arrays
  • 06FVG and IFVG visualization
  • 07CHOCH and MSS confirmation
  • 08Four fully editable sessions
  • 09Session highs, lows, and opens
  • 10Full, compact, and phone dashboards
  • 11Clean, Learning, Execution, Review, Phone, and Custom presets
  • 12Agreement and confluence scoring
  • 13Focus mode for active context
  • 14Distance filters for nearby levels
  • 15Finite lines and muted chart fills
  • 16Heatmap and watermark anchor controls
  • 17Mobile-first dashboard layout
  • 18245 documented settings with tooltips
PRODUCT / 02DELIVERY DECISION ENGINE

Range Analysis

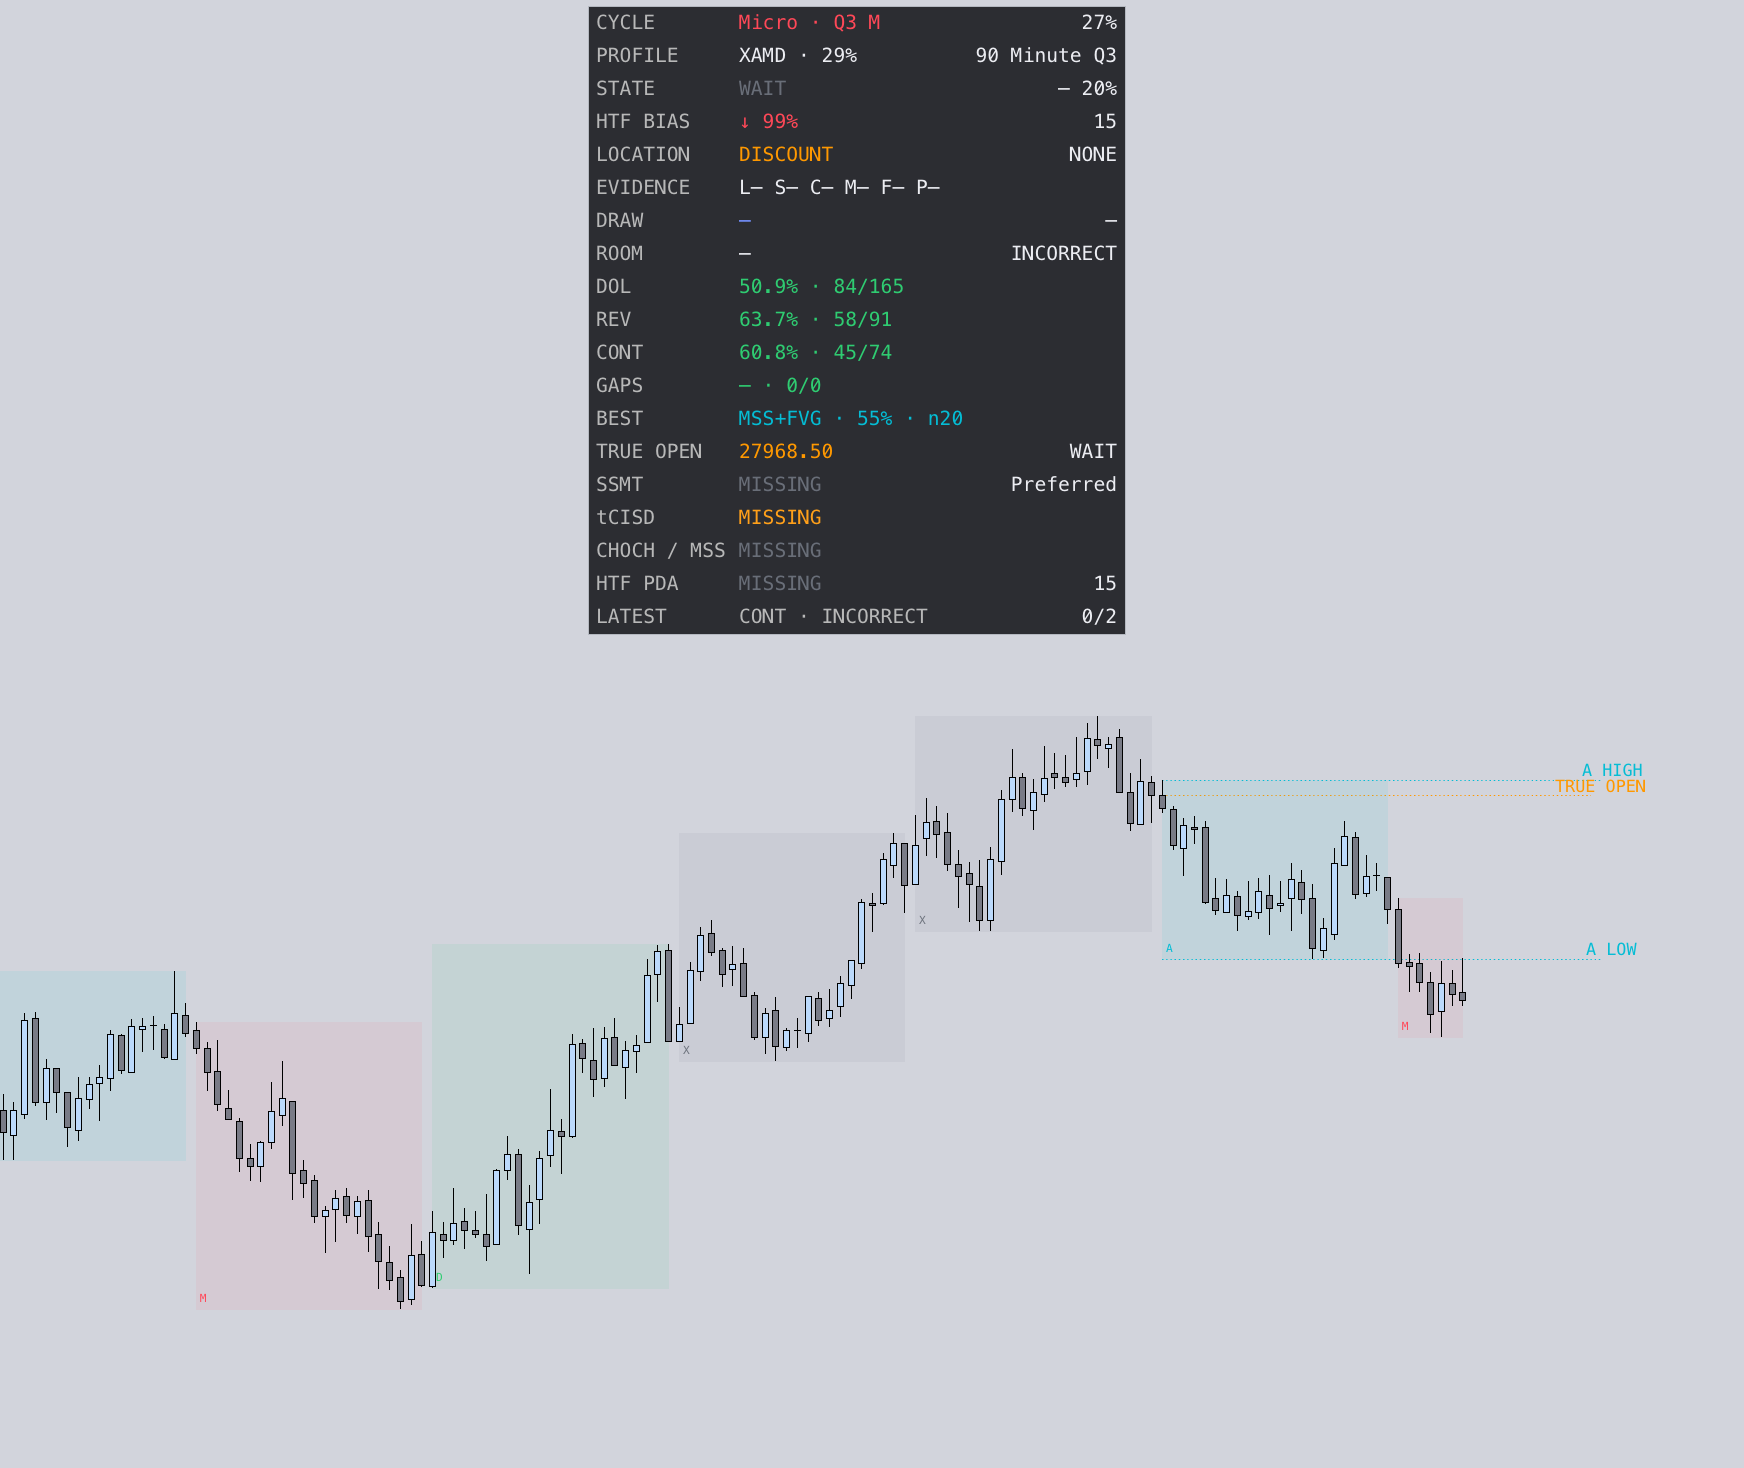
A disciplined range assistant that checks location, waits for evidence, identifies reversal or continuation, and locks the nearest reasonable draw.

Open the guide
Range Analysis indicator running on a TradingView chart with cycle dashboard, True Open, and accumulation levels
Live indicator captureRange Analysis
Complete feature inventory20 modules
  • 01Automatic Q1–Q4 cycle classification
  • 02True Open plotting
  • 03AMDX and XAMD profile detection
  • 04Manipulation and delivery logic
  • 05Reversal forecast detection
  • 06Continuation forecast detection
  • 07Maximum two forecasts per cycle
  • 08Locked internal draw on liquidity
  • 09Optional forecast invalidation
  • 10Liquidity-event confirmation
  • 11Sequential SMT evidence
  • 12tCISD confirmation
  • 13CHOCH and MSS evidence
  • 14FVG and IFVG evidence
  • 15Balanced quality profile
  • 16Candle-close confirmation
  • 17Essential and detailed chart modes
  • 18Compact phone dashboard
  • 19DOL, reversal, and continuation statistics
  • 20Built-in correctness tracking

02 / One-time access

Choose your edge.

Buy one indicator for $30, or get the complete system for $45 and save $15.

Single indicator

$30

Choose ICT or Range Analysis

01nq.coop ICT

Complete market structure and liquidity workspace.

02Range Analysis

Manipulation, delivery, and forecast assistant.

Secure checkout is created by the nq.coop backend and completed on Stripe. Apple Pay appears automatically on eligible devices. Indicators are educational analysis tools; purchase does not include financial advice or a promise of trading performance.

03 / Built with restraint

Less chart clutter.
More usable context.

01

Evidence first

Signals wait for defined market evidence. Weak conditions can produce no forecast at all.

02

Context stays visible

Bias, location, draw, confirmation, and invalidation stay together in compact dashboards.

03

Clean by default

Focus modes, filters, finite lines, muted fills, and phone layouts keep the chart readable.

04 / Product guides

From access to execution.

Open only the instruction you need. Every label stays tied to a practical chart decision.

GUIDE / 01

nq.coop ICT

Account access, presets, dashboard language, and chart control.

01 Account delivery +

After purchase, access is loaded directly onto the TradingView account submitted during checkout and appears there after payment is confirmed.

02 Choose a display preset +

CleanMinimal history and no dashboard explanations.

LearningDetailed dashboard explanations.

ExecutionReduced history with short explanations.

ReviewDetailed context for chart review.

PhoneForces the compact phone dashboard.

CustomRespects every detailed switch.

03 Read the dashboard +

BiasThe rules-based directional read.

ActionThe current condition or next confirmation.

DOLThe highest-ranked active draw on liquidity.

AgreementHow strongly current inputs align.

Agreement is rules-based confluence. It is not a probability or a performance promise.

04 Keep the chart clean +

Start with the Clean preset. Use focus mode and distance filtering, then turn on only the modules needed for the read.

Put the dashboard, heatmap, and watermark at different chart anchors. TradingView supports one table at each anchor.

GUIDE / 02

Range Analysis

Setup, forecast language, evidence, and starting settings.

01 Set up the working view +

Use the Balanced quality profile, confirm on candle close, and begin with Essential chart detail. The Phone dashboard is the cleanest starting layout on smaller screens.

Keep the True Open and active draw visible. Add deeper evidence labels only when reviewing a setup.

02 Read a forecast +

↻ ReversalReversal evidence has confirmed.

→ ContinuationDelivery evidence supports continuation.

◎ iDOLThe current internal draw on liquidity.

× INVThe optional forecast invalidation.

The indicator allows no more than two forecasts in one cycle. The limit is a maximum, not a quota.

03 Follow the evidence chain +

Liquidity event location SSMT tCISD CHOCH/MSS FVG/IFVG locked draw

The draw locks when the forecast appears. It cannot move later to improve the displayed result.

04 Recommended starting settings +

Quality profileBalanced

Sequential SMTPreferred

Confirm on candle closeOn

Chart detailEssential

DashboardPhone

Maximum forecasts2 per cycle

Built for deliberate traders

Two indicators.
One clean system.

Get one indicator for $30, or the complete ICT and Range Analysis system for $45.